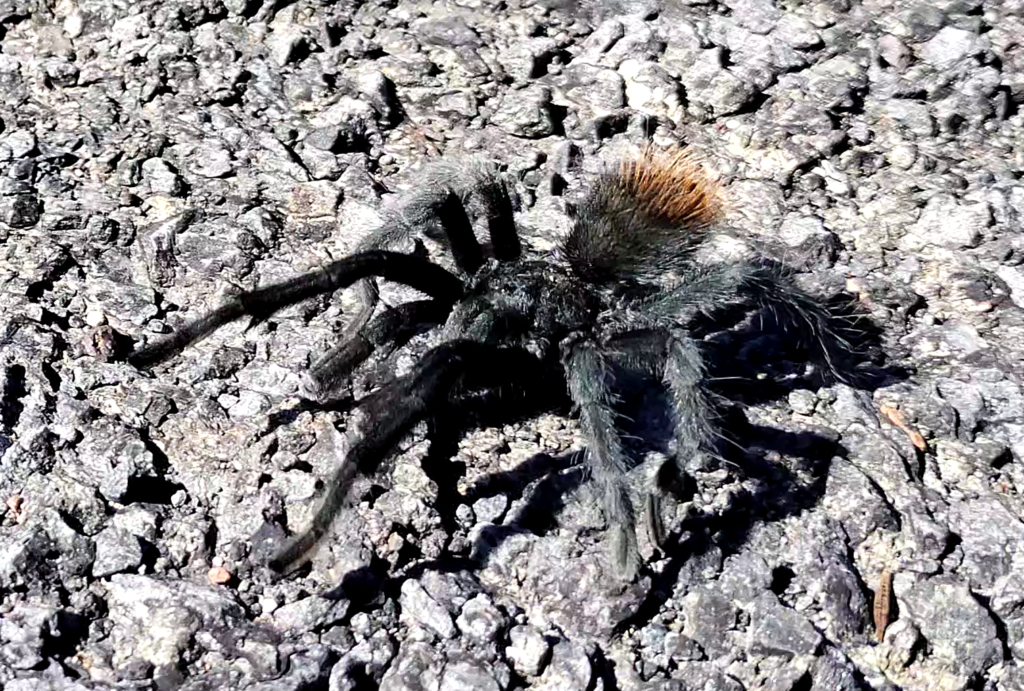
I think it is safe to say that tarantula season is over. Thank to everyone that contributed data this year, Steven H., Eric L., Bryce B., Karen L., and Richard S. Below is a summary table of the number of trips, miles covered, and tarantulas documented. 2020 was a pilot year where I and my partner were the only ones participating, in subsequent years I had a number of volunteers participate. I was hoping to retain a few more people from 2022 for 2023, but we covered more miles. Suggesting that we had more dedicated bicyclists this year. Let’s see if we can beat those numbers in 2024! We also had fewer tarantulas per mile compared to last year. I don’t have enough data to suggest if it was due to weather, or some other factor. It might be just normal oscillations in populations over time. I’ll analyze the data and update the results page, preliminary results suggest that the analyses I did last year still hold, but stay tuned.
Yearly summary of Cycle for Science – The Lake Mary Tarantula Project
| Year | Number of trips (people participating) | Total miles | Total tarantulas |
| 2020* | 25 (2) | 715 | 35 |
| 2021 | 38 (3) | 1034 | 34 |
| 2022 | 75 (11) | 2018 | 196 |
| 2023 | 62 (6) | 2063 | 110 |
